Report Summary

  • 6

    Performance

    Renders faster than
    21% of other websites

  • 57

    Accessibility

    Visual factors better than
    that of 24% of websites

  • 75

    Best Practices

    More advanced features
    available than in
    36% of websites

  • 76

    SEO

    Google-friendlier than
    35% of websites

munpia.com

웹소설의 유토피아, 글세상 문피아

Page Load Speed

13.5 sec in total

First Response

452 ms

Resources Loaded

12.7 sec

Page Rendered

420 ms
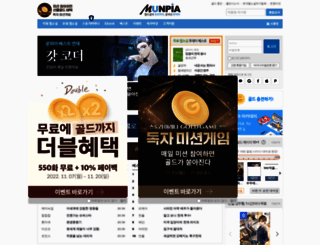
munpia.com screenshot

About Website

Click here to check amazing Munpia content for South Korea. Otherwise, check out these important facts you probably never knew about munpia.com

무료웹소설 최다 보유! 무협, 판타지, 인기 웹소설 연재 플랫폼, 무료 웹소설 아카데미 운영

Visit munpia.com

Key Findings

We analyzed Munpia.com page load time and found that the first response time was 452 ms and then it took 13.1 sec to load all DOM resources and completely render a web page. This is a poor result, as 90% of websites can load faster.

Performance Metrics

munpia.com performance score

6

Measured Metrics

name

value

score

weighting

FCP (First Contentful Paint)

Value12.7 s

0/100

10%

LCP (Largest Contentful Paint)

Value29.0 s

0/100

25%

SI (Speed Index)

Value37.1 s

0/100

10%

TBT (Total Blocking Time)

Value18,530 ms

0/100

30%

CLS (Cumulative Layout Shift)

Value0.282

43/100

15%

TTI (Time to Interactive)

Value36.8 s

0/100

10%

Network Requests Diagram

munpia.com

452 ms

www.munpia.com

1795 ms

fe52ae7bd60c797406e436e955454481.css

1113 ms

wcslog.js

21 ms

200

891 ms

Our browser made a total of 150 requests to load all elements on the main page. We found that 3% of them (5 requests) were addressed to the original Munpia.com, 83% (124 requests) were made to Static.munpia.com and 2% (3 requests) were made to Astg.widerplanet.com. The less responsive or slowest element that took the longest time to load (6 sec) relates to the external source Static.munpia.com.

Page Optimization Overview & Recommendations

Page size can be reduced by 8.3 MB (66%)

Content Size

12.7 MB

After Optimization

4.4 MB

In fact, the total size of Munpia.com main page is 12.7 MB. This result falls beyond the top 1M of websites and identifies a large and not optimized web page that may take ages to load. 65% of websites need less resources to load. Images take 12.1 MB which makes up the majority of the site volume.

HTML Optimization

-81%

Potential reduce by 95.4 kB

  • Original 117.2 kB
  • After minification 116.0 kB
  • After compression 21.8 kB

HTML content can be minified and compressed by a website’s server. The most efficient way is to compress content using GZIP which reduces data amount travelling through the network between server and browser. HTML code on this page is well minified. It is highly recommended that content of this web page should be compressed using GZIP, as it can save up to 95.4 kB or 81% of the original size.

Image Optimization

-65%

Potential reduce by 7.9 MB

  • Original 12.1 MB
  • After minification 4.2 MB

Image size optimization can help to speed up a website loading time. The chart above shows the difference between the size before and after optimization. Obviously, Munpia needs image optimization as it can save up to 7.9 MB or 65% of the original volume. The most popular and efficient tools for JPEG and PNG image optimization are Jpegoptim and PNG Crush.

JavaScript Optimization

-65%

Potential reduce by 218.9 kB

  • Original 339.2 kB
  • After minification 339.2 kB
  • After compression 120.4 kB

It’s better to minify JavaScript in order to improve website performance. The diagram shows the current total size of all JavaScript files against the prospective JavaScript size after its minification and compression. It is highly recommended that all JavaScript files should be compressed and minified as it can save up to 218.9 kB or 65% of the original size.

CSS Optimization

-82%

Potential reduce by 67.2 kB

  • Original 81.7 kB
  • After minification 80.4 kB
  • After compression 14.5 kB

CSS files minification is very important to reduce a web page rendering time. The faster CSS files can load, the earlier a page can be rendered. Munpia.com needs all CSS files to be minified and compressed as it can save up to 67.2 kB or 82% of the original size.

Requests Breakdown

Number of requests can be reduced by 18 (12%)

Requests Now

146

After Optimization

128

The browser has sent 146 CSS, Javascripts, AJAX and image requests in order to completely render the main page of Munpia. We recommend that multiple CSS and JavaScript files should be merged into one by each type, as it can help reduce assets requests from 9 to 1 for JavaScripts and as a result speed up the page load time.

Accessibility Review

munpia.com accessibility score

57

Accessibility Issues

Names and labels

These are opportunities to improve the semantics of the controls in your application. This may enhance the experience for users of assistive technology, like a screen reader.

Impact

Issue

High

Buttons do not have an accessible name

High

Image elements do not have [alt] attributes

Contrast

These are opportunities to improve the legibility of your content.

Impact

Issue

High

Background and foreground colors do not have a sufficient contrast ratio.

Navigation

These are opportunities to improve keyboard navigation in your application.

Impact

Issue

High

Heading elements are not in a sequentially-descending order

Internationalization and localization

These are opportunities to improve the interpretation of your content by users in different locales.

Impact

Issue

High

<html> element does not have a [lang] attribute

Tables and lists

These are opportunities to improve the experience of reading tabular or list data using assistive technology, like a screen reader.

Impact

Issue

High

List items (<li>) are not contained within <ul> or <ol> parent elements.

Best practices

These items highlight common accessibility best practices.

Impact

Issue

High

[user-scalable="no"] is used in the <meta name="viewport"> element or the [maximum-scale] attribute is less than 5.

Best Practices

munpia.com best practices score

75

Areas of Improvement

Trust and Safety

Impact

Issue

High

Does not use HTTPS

High

Includes front-end JavaScript libraries with known security vulnerabilities

Low

Ensure CSP is effective against XSS attacks

User Experience

Impact

Issue

High

Serves images with low resolution

General

Impact

Issue

Low

Detected JavaScript libraries

SEO Factors

munpia.com SEO score

76

Search Engine Optimization Advices

Crawling and Indexing

To appear in search results, crawlers need access to your app.

Impact

Issue

High

Links are not crawlable

High

Page is blocked from indexing

Content Best Practices

Format your HTML in a way that enables crawlers to better understand your app’s content.

Impact

Issue

High

Image elements do not have [alt] attributes

Mobile Friendly

Make sure your pages are mobile friendly so users don’t have to pinch or zoom in order to read the content pages. [Learn more](https://developers.google.com/search/mobile-sites/).

Impact

Issue

High

Document uses legible font sizes

High

Tap targets are not sized appropriately

Language and Encoding

  • Language Detected

    KO

  • Language Claimed

    KO

  • Encoding

    UTF-8

Language claimed in HTML meta tag should match the language actually used on the web page. Otherwise Munpia.com can be misinterpreted by Google and other search engines. Our service has detected that Korean is used on the page, and it matches the claimed language. Our system also found out that Munpia.com main page’s claimed encoding is utf-8. Use of this encoding format is the best practice as the main page visitors from all over the world won’t have any issues with symbol transcription.

Social Sharing Optimization

Open Graph data is detected on the main page of Munpia. This is the best way to make the web page social media friendly. Here is how it looks like on Facebook: