4 sec in total
36 ms
2.6 sec
1.4 sec
Visit mytechnologybusiness.com now to see the best up-to-date My Tech Nologybusiness content for Australia and also check out these interesting facts you probably never knew about mytechnologybusiness.com
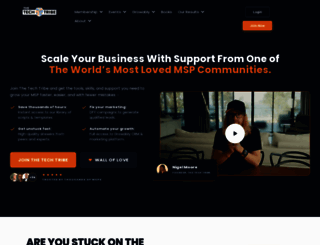
Grow your MSP faster. Get proven templates, done-for-you marketing, expert coaching, and join a thriving community of thousands of MSps today.
Visit mytechnologybusiness.comWe analyzed Mytechnologybusiness.com page load time and found that the first response time was 36 ms and then it took 4 sec to load all DOM resources and completely render a web page. This is a poor result, as 65% of websites can load faster.
mytechnologybusiness.com performance score
name
value
score
weighting
Value3.7 s
30/100
10%
Value6.2 s
11/100
25%
Value7.7 s
25/100
10%
Value1,510 ms
14/100
30%
Value0.542
13/100
15%
Value20.5 s
2/100
10%
36 ms
418 ms
241 ms
192 ms
150 ms
Our browser made a total of 108 requests to load all elements on the main page. We found that 1% of them (1 request) were addressed to the original Mytechnologybusiness.com, 89% (96 requests) were made to Thetechtribe.com and 5% (5 requests) were made to Fonts.googleapis.com. The less responsive or slowest element that took the longest time to load (1.4 sec) relates to the external source Thetechtribe.com.
Page size can be reduced by 243.6 kB (12%)
2.0 MB
1.8 MB
In fact, the total size of Mytechnologybusiness.com main page is 2.0 MB. This result falls beyond the top 1M of websites and identifies a large and not optimized web page that may take ages to load. 70% of websites need less resources to load. Images take 1.3 MB which makes up the majority of the site volume.
Potential reduce by 239.3 kB
HTML content can be minified and compressed by a website’s server. The most efficient way is to compress content using GZIP which reduces data amount travelling through the network between server and browser. HTML code on this page is well minified. It is highly recommended that content of this web page should be compressed using GZIP, as it can save up to 239.3 kB or 87% of the original size.
Potential reduce by 613 B
Image size optimization can help to speed up a website loading time. The chart above shows the difference between the size before and after optimization. My Tech Nologybusiness images are well optimized though.
Potential reduce by 1.7 kB
It’s better to minify JavaScript in order to improve website performance. The diagram shows the current total size of all JavaScript files against the prospective JavaScript size after its minification and compression. This website has mostly compressed JavaScripts.
Potential reduce by 2.0 kB
CSS files minification is very important to reduce a web page rendering time. The faster CSS files can load, the earlier a page can be rendered. Mytechnologybusiness.com has all CSS files already compressed.
Number of requests can be reduced by 71 (74%)
96
25
The browser has sent 96 CSS, Javascripts, AJAX and image requests in order to completely render the main page of My Tech Nologybusiness. We recommend that multiple CSS and JavaScript files should be merged into one by each type, as it can help reduce assets requests from 54 to 1 for JavaScripts and from 12 to 1 for CSS and as a result speed up the page load time.
mytechnologybusiness.com
36 ms
thetechtribe.com
418 ms
style.min.css
241 ms
thrive_flat.css
192 ms
theme.css
150 ms
styles.css
190 ms
style.css
101 ms
style.css
237 ms
style.css
244 ms
jquery.min.js
252 ms
jquery-migrate.min.js
366 ms
imagesloaded.min.js
271 ms
masonry.min.js
375 ms
jquery.masonry.min.js
346 ms
general.min.js
319 ms
moxie.min.js
349 ms
frontend.min.js
407 ms
css
39 ms
css
61 ms
css
64 ms
css
65 ms
css
68 ms
acf-dynamic-elements.min.js
531 ms
audio.min.js
530 ms
carousel-libs.min.js
531 ms
carousel.min.js
532 ms
contact-form-compat.min.js
532 ms
content-reveal.min.js
529 ms
countdown.min.js
707 ms
conditional-display.min.js
640 ms
search-form.min.js
642 ms
dropdown.min.js
709 ms
divider.min.js
641 ms
plupload.min.js
660 ms
file-upload.min.js
748 ms
client
77 ms
api.js
39 ms
avatar-picker.min.js
738 ms
fill-counter.min.js
759 ms
number-counter.min.js
772 ms
image-gallery-libs.min.js
861 ms
image-gallery.min.js
888 ms
lead-generation.min.js
926 ms
login.min.js
893 ms
vcd15cbe7772f49c399c6a5babf22c1241717689176015
87 ms
menu.min.js
892 ms
number-counter-compat.min.js
903 ms
post-grid-compat.min.js
922 ms
pagination.min.js
881 ms
post-list.min.js
889 ms
post-list-filter.min.js
875 ms
pricing-table.min.js
828 ms
progress-bar.min.js
959 ms
social-share.min.js
935 ms
table.min.js
936 ms
tabs.min.js
880 ms
timer.min.js
910 ms
toc.min.js
914 ms
toggle.min.js
963 ms
twitter.min.js
906 ms
gtm.js
273 ms
user-profile.min.js
694 ms
font
16 ms
font
59 ms
video.min.js
728 ms
google-api.min.js
788 ms
facebook-api.min.js
789 ms
modal.min.js
849 ms
frontend.min.js
893 ms
S6uyw4BMUTPHjx4wWw.ttf
742 ms
S6u9w4BMUTPHh6UVSwiPHA.ttf
677 ms
S6u9w4BMUTPHh50XSwiPHA.ttf
1139 ms
JTUHjIg1_i6t8kCHKm4532VJOt5-QNFgpCuM73w5aX8.ttf
1065 ms
JTUHjIg1_i6t8kCHKm4532VJOt5-QNFgpCtr6Hw5aX8.ttf
719 ms
S6u_w4BMUTPHjxsI5wq_Gwfo.ttf
1363 ms
S6u_w4BMUTPHjxsI3wi_Gwfo.ttf
1124 ms
S6u8w4BMUTPHjxsAXC-v.ttf
1193 ms
layout_30.jpg
727 ms
TTT_Logo-Small.png
744 ms
bg-login-pattern-1-1.png
795 ms
top-img.png
793 ms
icons_1-1-0E5AAB.webp
811 ms
icons_3-1.png
874 ms
icons_2-1-0E5AAB.png
884 ms
layout_13b.png
1020 ms
layout_04.png
906 ms
layout_06.png
959 ms
layout_08.png
955 ms
layout_10.png
951 ms
layout_15_01.png
911 ms
layout_15_03.png
982 ms
layout_11.png
835 ms
layout_18.png
907 ms
callum-768x768-1.jpg
901 ms
Damian-Wiseman-150x150-1.jpg
889 ms
vince-cooper.jpg
852 ms
mark-copeman.jpg
847 ms
aaron-jervis.jpg
819 ms
wayne-howard.jpg
791 ms
chris-tim.png
790 ms
Scott-Clark-150x150-1.jpg
757 ms
michael-768x768-1.jpg
729 ms
layout_20.jpg
723 ms
layout_22.png
717 ms
layout_24.png
637 ms
layout_23-279x300-1.png
754 ms
image-1.png
570 ms
main.js
16 ms
mytechnologybusiness.com accessibility score
Contrast
These are opportunities to improve the legibility of your content.
Impact
Issue
Background and foreground colors do not have a sufficient contrast ratio.
Names and labels
These are opportunities to improve the semantics of the controls in your application. This may enhance the experience for users of assistive technology, like a screen reader.
Impact
Issue
Links do not have a discernible name
mytechnologybusiness.com best practices score
Trust and Safety
Impact
Issue
Does not use HTTPS
Ensure CSP is effective against XSS attacks
General
Impact
Issue
Detected JavaScript libraries
Browser errors were logged to the console
mytechnologybusiness.com SEO score
Crawling and Indexing
To appear in search results, crawlers need access to your app.
Impact
Issue
Links are not crawlable
Mobile Friendly
Make sure your pages are mobile friendly so users don’t have to pinch or zoom in order to read the content pages. [Learn more](https://developers.google.com/search/mobile-sites/).
Impact
Issue
Document uses legible font sizes
![]()
EN
![]()
EN
UTF-8
Language claimed in HTML meta tag should match the language actually used on the web page. Otherwise Mytechnologybusiness.com can be misinterpreted by Google and other search engines. Our service has detected that English is used on the page, and it matches the claimed language. Our system also found out that Mytechnologybusiness.com main page’s claimed encoding is utf-8. Use of this encoding format is the best practice as the main page visitors from all over the world won’t have any issues with symbol transcription.
mytechnologybusiness.com
Open Graph description is not detected on the main page of My Tech Nologybusiness. Lack of Open Graph description can be counter-productive for their social media presence, as such a description allows converting a website homepage (or other pages) into good-looking, rich and well-structured posts, when it is being shared on Facebook and other social media. For example, adding the following code snippet into HTML <head> tag will help to represent this web page correctly in social networks: