Report Summary

  • 11

    Performance

    Renders faster than
    24% of other websites

  • 86

    Accessibility

    Visual factors better than
    that of 62% of websites

  • 75

    Best Practices

    More advanced features
    available than in
    36% of websites

  • 91

    SEO

    Google-friendlier than
    71% of websites

softblog.tw

軟體部落 - 綠色免安裝可攜版軟體免費分享下載

Page Load Speed

7.9 sec in total

First Response

361 ms

Resources Loaded

6.5 sec

Page Rendered

1 sec

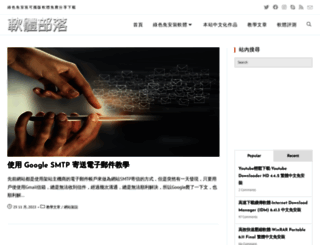
softblog.tw screenshot

About Website

Visit softblog.tw now to see the best up-to-date Softblog content for Taiwan and also check out these interesting facts you probably never knew about softblog.tw

綠色免安裝可攜版軟體免費分享下載

Visit softblog.tw

Key Findings

We analyzed Softblog.tw page load time and found that the first response time was 361 ms and then it took 7.5 sec to load all DOM resources and completely render a web page. This is a poor result, as 85% of websites can load faster. This domain responded with an error, which can significantly jeopardize Softblog.tw rating and web reputation

Performance Metrics

softblog.tw performance score

11

Measured Metrics

name

value

score

weighting

FCP (First Contentful Paint)

Value3.0 s

50/100

10%

LCP (Largest Contentful Paint)

Value8.9 s

1/100

25%

SI (Speed Index)

Value12.5 s

3/100

10%

TBT (Total Blocking Time)

Value3,040 ms

2/100

30%

CLS (Cumulative Layout Shift)

Value0.365

29/100

15%

TTI (Time to Interactive)

Value18.0 s

3/100

10%

Network Requests Diagram

softblog.tw

361 ms

softblog.tw

2546 ms

wp-emoji-release.min.js

248 ms

polls-css.css

248 ms

pagenavi-css.css

247 ms

Our browser made a total of 142 requests to load all elements on the main page. We found that 41% of them (58 requests) were addressed to the original Softblog.tw, 7% (10 requests) were made to Static.xx.fbcdn.net and 6% (9 requests) were made to Img.scupio.com. The less responsive or slowest element that took the longest time to load (2.5 sec) belongs to the original domain Softblog.tw.

Page Optimization Overview & Recommendations

Page size can be reduced by 815.5 kB (26%)

Content Size

3.2 MB

After Optimization

2.3 MB

In fact, the total size of Softblog.tw main page is 3.2 MB. This result falls beyond the top 1M of websites and identifies a large and not optimized web page that may take ages to load. 70% of websites need less resources to load. Images take 2.2 MB which makes up the majority of the site volume.

HTML Optimization

-83%

Potential reduce by 119.3 kB

  • Original 144.5 kB
  • After minification 138.0 kB
  • After compression 25.3 kB

HTML content can be minified and compressed by a website’s server. The most efficient way is to compress content using GZIP which reduces data amount travelling through the network between server and browser. HTML code on this page is well minified. It is highly recommended that content of this web page should be compressed using GZIP, as it can save up to 119.3 kB or 83% of the original size.

Image Optimization

-10%

Potential reduce by 216.1 kB

  • Original 2.2 MB
  • After minification 2.0 MB

Image size optimization can help to speed up a website loading time. The chart above shows the difference between the size before and after optimization. Softblog images are well optimized though.

JavaScript Optimization

-55%

Potential reduce by 318.3 kB

  • Original 576.7 kB
  • After minification 516.1 kB
  • After compression 258.4 kB

It’s better to minify JavaScript in order to improve website performance. The diagram shows the current total size of all JavaScript files against the prospective JavaScript size after its minification and compression. It is highly recommended that all JavaScript files should be compressed and minified as it can save up to 318.3 kB or 55% of the original size.

CSS Optimization

-83%

Potential reduce by 161.9 kB

  • Original 195.4 kB
  • After minification 168.7 kB
  • After compression 33.5 kB

CSS files minification is very important to reduce a web page rendering time. The faster CSS files can load, the earlier a page can be rendered. Softblog.tw needs all CSS files to be minified and compressed as it can save up to 161.9 kB or 83% of the original size.

Requests Breakdown

Number of requests can be reduced by 85 (64%)

Requests Now

132

After Optimization

47

The browser has sent 132 CSS, Javascripts, AJAX and image requests in order to completely render the main page of Softblog. We recommend that multiple CSS and JavaScript files should be merged into one by each type, as it can help reduce assets requests from 65 to 1 for JavaScripts and from 14 to 1 for CSS and as a result speed up the page load time.

Accessibility Review

softblog.tw accessibility score

86

Accessibility Issues

ARIA

These are opportunities to improve the usage of ARIA in your application which may enhance the experience for users of assistive technology, like a screen reader.

Impact

Issue

High

[aria-*] attributes do not match their roles

Contrast

These are opportunities to improve the legibility of your content.

Impact

Issue

High

Background and foreground colors do not have a sufficient contrast ratio.

Names and labels

These are opportunities to improve the semantics of the controls in your application. This may enhance the experience for users of assistive technology, like a screen reader.

Impact

Issue

High

<frame> or <iframe> elements do not have a title

High

Links do not have a discernible name

Navigation

These are opportunities to improve keyboard navigation in your application.

Impact

Issue

High

Heading elements are not in a sequentially-descending order

Best Practices

softblog.tw best practices score

75

Areas of Improvement

Trust and Safety

Impact

Issue

High

Does not use HTTPS

Low

Ensure CSP is effective against XSS attacks

User Experience

Impact

Issue

High

Serves images with low resolution

General

Impact

Issue

Low

Detected JavaScript libraries

High

Browser errors were logged to the console

SEO Factors

softblog.tw SEO score

91

Search Engine Optimization Advices

Crawling and Indexing

To appear in search results, crawlers need access to your app.

Impact

Issue

High

Links are not crawlable

Mobile Friendly

Make sure your pages are mobile friendly so users don’t have to pinch or zoom in order to read the content pages. [Learn more](https://developers.google.com/search/mobile-sites/).

Impact

Issue

High

Document uses legible font sizes

High

Tap targets are not sized appropriately

Language and Encoding

  • Language Detected

    JA

  • Language Claimed

    ZH

  • Encoding

    UTF-8

Language claimed in HTML meta tag should match the language actually used on the web page. Otherwise Softblog.tw can be misinterpreted by Google and other search engines. Our service has detected that Japanese is used on the page, and it does not match the claimed Chinese language. Our system also found out that Softblog.tw main page’s claimed encoding is utf-8. Use of this encoding format is the best practice as the main page visitors from all over the world won’t have any issues with symbol transcription.

Social Sharing Optimization

Open Graph data is detected on the main page of Softblog. This is the best way to make the web page social media friendly. Here is how it looks like on Facebook: